On August 14, the S&P 500 dropped nearly 3%, and the Dow shed 800 points, making it the worst one-day decline of 2019. The cause? A yield curve inversion in which the yield on 10-year Treasuries dipped below the rate on 2-year Treasuries. Normally, the 10-year rate should be higher than the 2-year rate since it should take a higher yield to entice investors to lock up their money for 10 years instead of two years. So, why did this phenomenon have such a profound impact on the equity markets, and what does it mean looking forward? Historically, whenever 10-year Treasury notes yield less than 2-year notes, it has been a precursor to a looming recession (see chart below; recessions are shaded in gray).
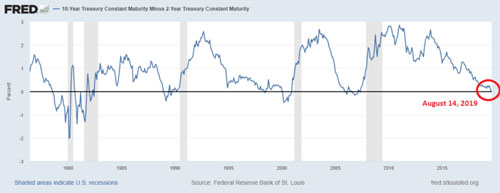
The theory is that when this inversion happens, the bond market is flashing a warning signal that investors and businesses are not seeing better opportunities in which to invest their cash other than the liquid 10-year note. If these market participants are keeping their cash on the sidelines rather than investing in capital expenditures (new factories, trucks, materials, etc.), it can signify that these investors do not see the economic outlook looking favorable. If businesses reduce their spending, the economy will also slow down, potentially to the point of contraction, thus, a recession.
So what does this mean for an investor’s portfolio?
As the chart below from Ned Davis Research demonstrates, past recessions have often occurred more than a year after an inversion, with broad equity markets frequently returning positive results 3, 6, and 12 months after the inversion. In the case of the last 10-year/2-year Treasury yield curve inversion, it took nearly 2 years for the recession of 2008 to kick in, fueled by the financial crisis.
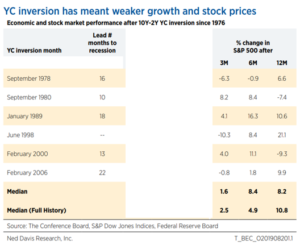
It should be noted that not all treasury yield curve inversions are precursors to a recession. One example is the June 1998 inversion that coincided with the Russian financial crisis and the implosion of the highly levered hedge fund Long Term Capital Management. Most of the time, yield curve inversions work as a reliable indicator of an impending recession, even though that may occur several months (even years) later. But the signal is not infallible, as the inversion in 1998 highlights. Ned Davis Research points out that, historically, regardless of whether a yield curve inversion leads to a recession, equities have increased in volatility after the inversion, even though prices have risen 12 months later. We observed this kind of increase in volatility during August, due in large part to troubled trade negotiations between the U.S. and China.
FSA’s Position
We raised some cash levels in most client accounts after the August volatility triggered some FSA Safety Net® sells. However, neither the broad markets nor our funds have breached any of their major technical support levels. Should markets head lower from here, we will continue to increase our cash levels as dictated by the FSA Safety Net® triggers. Given that markets can still head higher for several months after an inversion, we will not sell simply because of the latest inversion but only if and when the markets turn down. We will continue to closely monitor market trends in order to be properly allocated in the event that this latest yield curve inversion does, in fact, accurately predict the next economic recession.
Derek Kravitz
Investment Analyst
Disclosures are available at https://fsainvest.com/disclosures/market-update/.
FSA’s current written Disclosure Brochure and Privacy Notice discussing our current advisory services and fees is available at www.FSAinvest.com/disclosures or by calling 301-949-7300.