
The returns from stocks in the first half of the year were the strongest we’ve seen in over 30 years. So it should not be surprising that markets cooled off in the third quarter. Historically, the third quarter is often more anemic than other quarters, and this year, in particular, given the strong bounce from the low levels hit last December, it seems natural that stocks would take time to digest those gains in the first half.
The issues that have put a lid on stock returns remain the same ones we have discussed all year:
- Concern over the Federal Reserve’s handling of interest rates
- The trade dispute with China
- Global economic weakness
For market observers, the concern over weakening economic growth represents the 400-pound gorilla in the room. Many believe the ongoing trade dispute with China is contributing to the consistent decline in economic output around the world and we are just beginning to see some impact in the U.S. First-quarter economic growth came in at 3.1%, with second-quarter growth slipping to 2.0% and forecasts for the third quarter of around 1.5%. This, of course, is making observers nervous that if growth flattens out too much, the U.S.—and indeed, the entire world—could slip into recession.
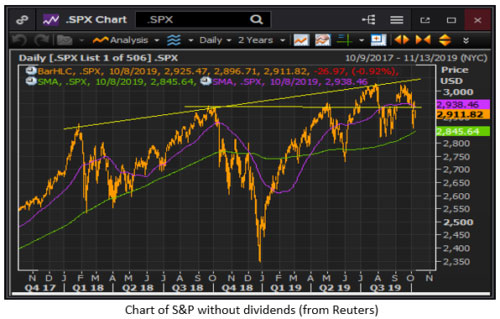
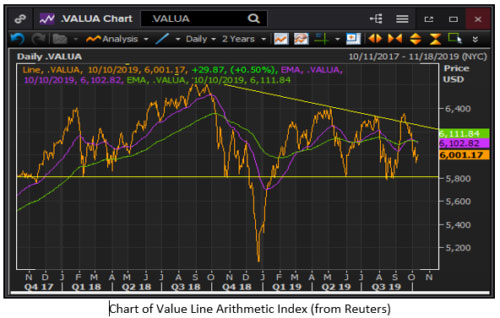
The following two charts continue to frame our view of the overall market. The first chart (S&P 500 index) shows stocks near the upper edges of a trading range going back to January 2018, weighed down by the factors discussed above. Even though this index comprises 500 names, the returns are dominated by a handful of the largest stocks, such as Apple, Microsoft, and Amazon. The second chart represents 1700 stocks and gives equal weight to all of them; therefore, it offers a more accurate picture of how the typical stock is behaving. The pattern of this chart shows that stocks are closer to breaking into a downtrend than into a new uptrend. From our perspective, this is troubling. It highlights that while a handful of stocks are close to breaking out to new highs, most stocks are struggling.
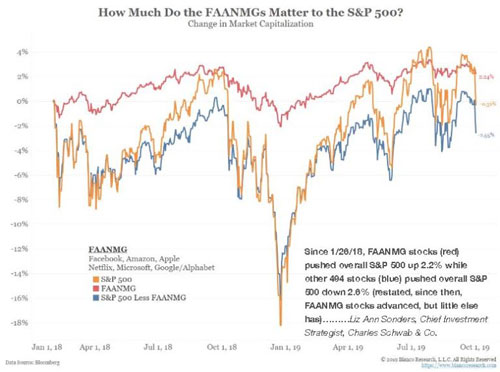
This dichotomy between the few elite stocks holding their own versus the silent majority can also be seen in the chart below, courtesy of Bianco Research. It shows that since January 2018 the six stocks listed, including Facebook, Amazon, Apple, Netflix, Microsoft, and Google (Alphabet), are up 2%, while the other 494 stocks are actually down over 2%. This chart shows that these indexes can sometimes mask underlying weakness in the broad stock market even as the indexes appear healthy.
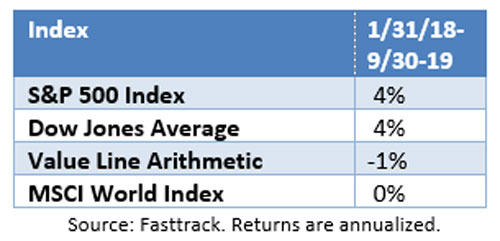
To highlight how difficult it has been to make money over the past few years of volatile, sideways market action, consider the table below which shows the annualized returns of several equity indices from January 31, 2018, through the end of September 2019. As you can see, there has not been much progress in nearly two years with the S&P 500 index and the Dow Jones Industrial Average generating only 4% annually over that time. Broader indices, such as the Value Line and the MSCI World index, have basically generated no returns in the same period.
Outlook Through Year End
As stocks have stalled near the highs on the S&P 500 index, we have not made many changes. We continue to hold some cash, with most strategies holding roughly 70% to 75% of their maximum equity allocations. In addition, we have reduced the growth bias in our portfolios as well as our sector fund positions. Currently, the portfolios are invested in a number of our favorite managed mutual funds, which are typically lower risk than the broad market. In addition to these funds, we have several broad market funds that tend to closely track the movements of the overall stock market.
While we wait for the stock market to break out of this sideways landing (either increasing to new all-time highs or rolling over into a new bear market), we continue to search for areas of the market that are showing signs of strength. We will soon enter a seasonally strong time for stocks (November through January), so we want to be ready if stocks do, indeed, break higher. At the same time, with most stocks struggling to break to new highs, we are monitoring the FSA Safety Nets® closely and will not hesitate to reduce and/or sell any holdings that breaks our exit trigger.
Recent Schwab News
You may have read in the news that Schwab recently eliminated all trading fees for clients that buy or sell exchange-traded funds (ETFs). This is good news for FSA clients because it will eliminate the fee that Schwab formerly imposed to buy or sell certain ETFs.
Portfolio Update
Keep in mind that because we manage clients’ portfolios individually, the holdings in your particular accounts may differ somewhat from the averages.
Income (Strategy 1)
Bonds continue to be the surprise winners for 2019, given the forecasts by most analysts at the beginning of the year. However, when the Federal Reserve abruptly changed course from raising interest rates to lowering them, that provided a tailwind for bonds. The only trade over the past quarter was to sell a more aggressive high yield fund and add that money to an existing high yield municipal fund and a high-quality bond fund. Currently, the Income portfolios hold 30% in high yield bonds, 40% in higher quality intermediate-term funds, and 25% in high yield municipal bond funds. The money market position remains near 5%.
Income & Growth (Strategy 2)
We did only minimal trading in this conservative strategy, selling a high yield bond fund. We have been content with the mix of lower risk equity funds, plus high yield bond funds and higher quality bond funds. As of the end of September, these portfolios held 35% in equities, 30% in high yield bond funds, 20% in high quality bond funds, and 15% in money market funds.
Conservative Growth (Strategy 3)
We made only minimal trades in this strategy. During the August decline, we sold the large-cap growth fund and then added a broad market fund in September as stocks rebounded. Otherwise, we have been comfortable with our current mix of stock and bond funds. Currently, these portfolios hold 54% in stock funds, with 17% in high yield bond funds, 15% in bonds, and 14% in money market funds.
Core Equity (Strategy 4)
As the choppiness in stocks continues, we have reduced our allocation to sector funds and have remained with broader equity funds. During the quarter, we sold the emerging market fund as well as the precious metals equity fund as they broke our exit point. In late September, we bought a pure gold fund (not gold stocks, but the commodity) as gold has been a good hedge for equity volatility. As of the quarter’s end, this strategy held roughly 75% in equities and 25% in money market funds.
Tactical Growth (Strategy 5)
Trading was relatively subdued in this strategy, and the broad market positions and real estate and consumer staples sector funds were fairly consistent performers in the third quarter. As we enter the final quarter of the year, these portfolios hold roughly 50% in diversified equity funds, 30% to 40% in various sector funds, and 15% to 20% in money market funds.
Sector Rotation (Strategy 6)
There continues to be a fairly high level of turnover in this strategy from month to month as a result of the ongoing market volatility. Only semiconductor stocks have remained in the portfolio over the past four months. As of the October rotation, the portfolios hold semiconductor stocks, industrials, financial services, real estate, utilities, and consumer staples.
Please remember to inform your advisor of any changes in your life that could affect your investment objective and how we manage your money.
FSA Investment Team
Disclosures are available at https://fsainvest.com/disclosures/market-update/.
FSA’s current written Disclosure Brochure and Privacy Notice discussing our current advisory services and fees is also available at https://fsainvest.com/disclosures/ or by calling 301-949-7300.