
Stocks continued to climb out of the deep hole dug in the first quarter as the impact of the coronavirus ground economic activity to a halt. The S&P 500 index flirted with reaching an all-time high in the third quarter, and while most other indices have not recovered as strongly, they have all made impressive rebounds from the troughs hit in March.
The performance of the S&P 500 index seems at odds with what we hear in the news:
- Unemployment levels have remained elevated (around 8%).
- Coronavirus cases are expanding in many places around the world.
- A contentious presidential election campaign has contributed to a general unease.
The chart below tracks the year-to-date performance of the S&P 500 index, and from the looks of things, it seems as though we’re getting back to normal. Yet, it’s hard to square that with the issues above. The fact that even President Trump has contracted the coronavirus shows how vulnerable we remain to the disease.
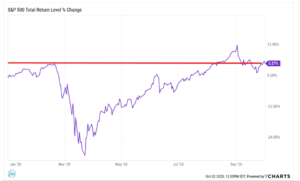
So, who should we believe, the markets or the media? It’s helpful to point out a major difference between the two. The media report on current events and thus reflect what is happening at the moment. Stock market activity involves looking ahead to project future economic growth and inflation, to guide decisions about buying companies based on likely future earnings for shareholders.
So, positive stock market activity reflects expectations that the economy will continue to recover, with less concern about the current bad news. Imbedded in this rather optimistic scenario is an assumption that the coronavirus will not cause another serious wave of infections and that a vaccine will be discovered relatively soon and that there will not be major upheaval in the event of a seismic shift in the political landscape after the election (i.e., a Democratic “blue wave”). Developments that challenge these assumptions will require market participants to adjust their outlook, and that could create downward pressure on stocks.
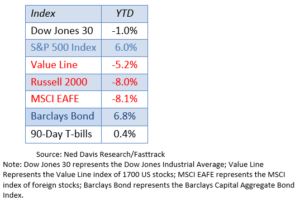
The table below shows that the S&P 500 index and the major bond index are both positive for the year, while most other indices remain in negative territory even though nearly all areas of the market have staged impressive rebounds (oil and energy prices being the notable exceptions).
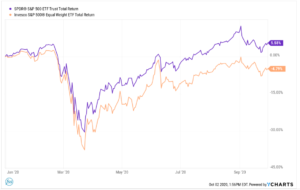
A striking feature of the markets for the past several years has been the concentration of returns from a relatively small group of stocks rather than broad participation by a large swath of the stock universe. If the generals and the troops are marching together, that is a sign of a healthy stock market. When the leaders are moving much faster than the troops, it is often a sign of a market at risk. As an example of this, refer to the chart below. It shows the returns for 2020 for the S&P 500 index which is constructed so that the largest companies have the biggest impact on the returns (think of stocks like Apple, Amazon, Google, Microsoft, etc.). Plotted on the same chart is an index that includes the same 500 stocks, but this index applies the same weighting to all 500 stocks. So, Apple has the same weight as Align Technologies, the maker of Invisalign teeth straighteners. Notice the large discrepancy in returns for 2020. While the S&P is up 6% for the year, the equal-weight S&P index is down 5%, a spread of 11%. Clearly, the troops are not keeping pace with the generals, posing a source of caution for us.
Outlook for the Remainder of 2020
We are typically more bullish entering the fourth quarter since historically there has been a positive bias at this time of year. Of course, there is nothing typical about this year. So, as we step into the final quarter, we are maintaining a moderately cautious stance. During the September correction, we raised cash in most portfolios a bit, and we continue to hold that cash.
From a technical standpoint, it’s hard to be too negative at this time. Stocks and bonds have rebounded nicely from the first quarter plunges and have resumed uptrends, notwithstanding some recent choppiness. Several stock funds tripped their exit triggers during the September pullback, but stocks mounted a minor recovery after that, so our selling was contained. If stocks roll over once again, the selling could pick up rather quickly since stocks are already down from their high levels in early September.
Just remember that stocks are looking ahead into next year to determine the prospects for corporate earnings and are not as focused on what is happening today and what events are dominating the news. In any event, the FSA Safety Nets® are active and ready to deploy at any time if stocks retreat before the election.
Portfolio Update
Keep in mind that because we manage clients’ portfolios individually, the holdings in your particular accounts may differ somewhat from the averages.
Income (Strategy 1)
After a strong move higher in July, bonds stalled out for the remainder of the quarter. We added a high yield municipal bond fund in July and an intermediate bond fund in late September. At the quarter’s end, these portfolios were 90% invested, with 10% held in money market funds.
Income & Growth (Strategy 2)
Trading was fairly light in the third quarter. We added a convertible securities fund in July and sold a large-cap stock fund in the September pullback. As of the quarter’s end, the portfolios held 40% in equities and 40% in bonds, with 20% in money markets.
Conservative Growth (Strategy 3)
Trading was also light in our flagship strategy. We added a large-cap growth fund in August, but that is the fund that tripped through its FSA Safety Net® during the September pullback. At the quarter’s end, the portfolios were only 40% in equities, 10% in a market neutral fund, with 30% in bonds (both high yield and high quality), and 20% in money markets.
Core Equity (Strategy 4)
With a high allocation to stocks, the Core Equity portfolios participated in the strong equity rally in the third quarter. During the quarter, we tilted the portfolios more toward growth-oriented funds. In September, however, as growth stocks fell, we brought that allocation down a bit, while adding modest positions in transportation stocks and homebuilders. As we step into the fourth quarter, the portfolios are 75% in equities, with 25% in money markets.
Tactical Growth (Strategy 5)
These portfolios were also heavily allocated to stocks throughout the third quarter and participated nicely in the third quarter rebound. During the quarter, we sold the gold and biotechnology positions, while adding transportation and basic materials funds to some of the portfolios while increasing an inverse energy position in others. At the beginning of October, Tactical Growth accounts held roughly 70% in equities, 5% in precious metals, and 25% in money markets.
Sector Rotation (Strategy 6)
This strategy continues to do well in this unusual market year. Interestingly, for the October rotation, all three technology funds were sold. Currently, the strategy holds industrials, transportation, basic materials, retail, consumer products, and leisure sector funds.
Please remember to inform your advisor of any changes in your life that could affect your investment objective and how we manage your money.
Ronald Rough, CFA
Chief Investment Officer
Disclosures are available at https://fsainvest.com/disclosures/market-update/.
FSA’s current written Disclosure Brochure and Privacy Notice discussing our current advisory services and fees is also available at https://fsainvest.com/disclosures/ or by calling 301-949-7300.